In the world of analytics, time isn’t just a number on a clock—it’s the rhythm of every decision. Think of data science as an orchestra. Each instrument—sales, marketing, operations, and finance—plays its notes. But the conductor that keeps them in harmony is time. Without understanding when things happen, even the most powerful insights sound off-key. This is where Date and Time-of-Day Dimensions step in, turning temporal chaos into structured symphonies of understanding.
1. The Backbone of Temporal Intelligence
Imagine running a café chain across multiple cities. Every morning, customers pour in for their coffee fix, but sales fluctuate mysteriously. Mondays are quiet, Fridays buzz with energy, and holidays see an unexpected surge. How do you decode this rhythm?
A Date Dimension table does the magic—it organizes every possible date into a structured format, complete with attributes like day of the week, fiscal quarter, holiday flag, and more. Similarly, a Time-of-Day Dimension tracks every minute or second, categorizing time into shifts, peak hours, or late-night lulls.
Together, these tables help analysts zoom out to see yearly patterns or zoom in to detect second-by-second trends. Students in a data analyst course in Pune often encounter these dimensions when learning about data warehousing—because without them, time-based insights would simply vanish in the noise.
2. Beyond Timestamps: Turning Time into Insight
Raw timestamps are like raw ingredients—they need context and preparation. A transaction timestamp, “2025-11-04 08:32:00,” tells when something happened but not why it matters. Was it a public holiday? Morning rush hour? End of a fiscal quarter?
That’s where specialized time dimensions elevate data analysis. These dimensions translate timestamps into narratives: “Morning purchase on a working Tuesday in Q4.” Suddenly, business leaders can connect decisions with customer behavior.
For instance, an e-commerce platform once discovered that its flash sales performed best between 7:00–8:00 p.m.—a window when people had finished dinner and were scrolling through deals on their phones. Without a Time-of-Day dimension, such precision would have been impossible.
Similarly, learners in a data analytics course are trained to model these time hierarchies in SQL or Power BI to generate period-over-period comparisons—because time is the silent storyteller behind every dataset.
3. Case Study 1: The Airline That Mastered Takeoff Timing
An international airline noticed fluctuating check-in rates across different airports. Instead of relying on raw timestamps, they implemented Date and Time-of-Day Dimension tables within their data warehouse.
By doing so, analysts discovered patterns invisible before: business travelers booked early-morning flights on Mondays and Thursdays, while leisure travelers preferred Friday evenings. This insight led to tailored staffing schedules and dynamic ticket pricing that boosted profits by 15%.
The takeaway? When time is structured, decisions take flight—literally.
4. Case Study 2: The Streaming Giant’s Prime Time Discovery
A global streaming platform wanted to understand why certain shows gained traction at specific hours. Their engineers built a Time-of-Day dimension to map viewing activity across time zones.
The results were surprising. Romantic comedies spiked during lunch breaks, documentaries saw peaks on Sunday afternoons, and thrillers dominated midnight slots. These revelations allowed the platform to schedule recommendations based on users’ time-of-day habits—significantly improving engagement metrics.
Professionals mastering this concept in a data analyst course in Pune learn to replicate such scenarios. They simulate time-based aggregations to design dashboards that reveal when and why digital engagement surges.
5. Case Study 3: The Retail Chain That Beat Seasonal Blindness
A large retail chain struggled with seasonal forecasting. Despite tracking sales daily, managers couldn’t distinguish between holiday-driven spikes and regular weekend boosts. The solution was simple yet transformative: build Date Dimension tables enriched with holiday flags, fiscal calendars, and cultural events.
Once implemented, the analytics team found that December’s sales spike wasn’t uniform—it peaked in the second week when corporate gifting began. With this clarity, they optimized inventory and reduced overstock by 22%.
Students in a data analytics course often replicate such case studies to grasp how temporal intelligence drives strategy. By merging transactional data with rich date attributes, they uncover the stories hidden between calendar lines.
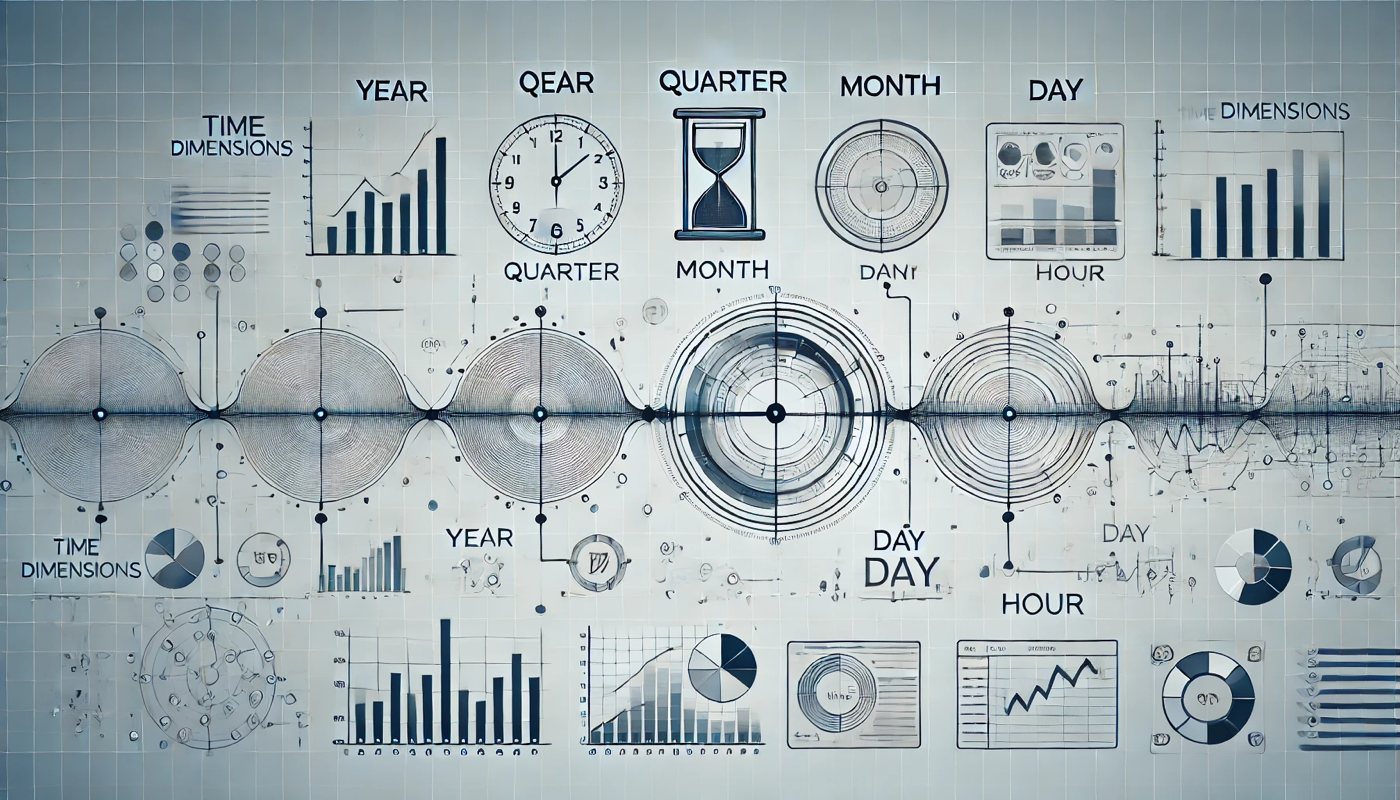
6. The Art of Designing Time Dimensions
Creating Date and Time-of-Day tables isn’t a one-size-fits-all task—it’s a craft. Each organization must decide the granularity (minute, hour, day), attributes (holiday flags, fiscal weeks), and relationships to other dimensions (region, department, or product).
A well-designed Date Dimension includes:
- Hierarchies like Year → Quarter → Month → Week → Day
- Flags for holidays, weekends, or special events
- Fiscal indicators aligned with business cycles
The Time-of-Day Dimension might include:
- Hour blocks (e.g., Early Morning, Afternoon, Late Night)
- Shift identifiers for operations and logistics
- Peak and off-peak labels for load balancing
When blended with fact tables, these dimensions unlock analyses like “Compare Q2 weekday sales during morning shifts to last year’s.” That’s the kind of precision modern businesses crave—and the kind of skill taught rigorously in a data analyst course in Pune.
Conclusion: Time as the Pulse of Data Strategy
In analytics, time is not a variable—it’s the pulse of understanding. Without Date and Time-of-Day dimensions, insights remain scattered, disconnected from the real rhythms of human behavior. Whether it’s predicting when customers click, when flights fill, or when demand surges, temporal modeling transforms raw data into living stories.
Mastering these specialized tables is like learning to read the heartbeat of a business. For anyone embarking on a data analytics course or pursuing advanced analytical careers, understanding time dimensions is no longer optional—it’s the compass that guides every data-driven journey.
Business Name: ExcelR – Data Science, Data Analytics Course Training in Pune
Address: 101 A ,1st Floor, Siddh Icon, Baner Rd, opposite Lane To Royal Enfield Showroom, beside Asian Box Restaurant, Baner, Pune, Maharashtra 411045
Phone Number: 098809 13504
Email Id: enquiry@excelr.com